Industrial Demand Increases Amid Manufacturing Boom
There has been a three-fold increase in construction spending on manufacturing since 2021.
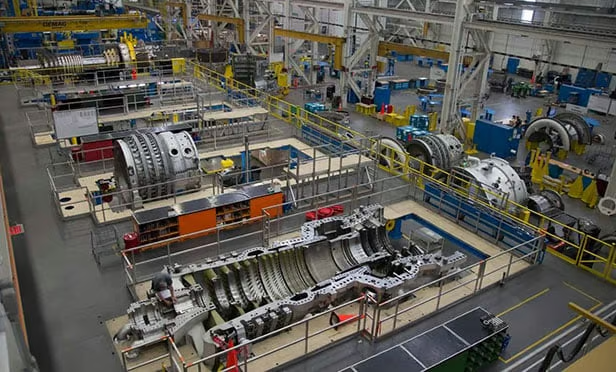
Manufacturing in the U.S. is continuing to expand and impact industrial real estate. Over and above the 100 million square feet of manufacturing space that has been delivered in the U.S. since 2022 and the additional 100 million square feet now under construction, there is a multiplier effect as related suppliers and logistics networks add new facilities.
That factor will spur millions of square feet of additional development, according to CommercialEdge’s February industrial market report. It cited the example of the massive $5.9 billion Hyundai Metaplant now up and running in Ellabell, Georgia. It has attracted billions of dollars in fresh investment nearby from at least 18 major suppliers, mostly large Korean companies.
The site’s proximity to the Port of Savannah was a huge selling point. However, being close to a port may no longer be as important. “The industrial sector has slowly moved away from being dominated by port-adjacent markets in the recent quarter, a trend that can be seen in 2024’s year-end sales data,” the report noted.
“Dallas-Fort Worth led the nation with nearly $6 billion in industrial sales last year, followed by Houston ($3.4 billion) and Phoenix ($3.4 billion). Los Angeles saw the biggest sales volume of any port market in 2024 and finished fourth overall, with $3.2 billion in industrial sales. This contrasts with previous years, where port-adjacent markets outpaced the nation in sales activity.”
The report cited Census Bureau figures showing a three-fold increase in construction spending on manufacturing since 2021. Nationwide, 346.2 million square feet – 1.7% of total stock — was under construction in January 2025. “However, the industry still faces challenges in terms of bringing about a full-scale manufacturing resurgence,” the report noted.
Headwinds include location selection, availability of land, access to water, power and skilled labor, as well as potential tariffs on foreign products and retaliatory tariffs on U.S.-made goods that could spark a trade war.
A positive factor was the 9.4% year-over-year increase in e-commerce sales, which totaled $308.9 billion in 4Q 2024. For the eighth consecutive quarter, e-commerce’s share of core retail sales rose, climbing 20 basis points to 19.3% above 3Q 2024. “Estimates place e-commerce sales as needing three times as much square footage per dollar than traditional brick and mortar,” the report noted, viewing them as “a major driver of industrial real estate demand.”
New construction has led to an increase in vacancy rates. However, they are expected to stabilize in 2025 and diminish toward the end of the year. Even though industrial vacancy has risen in port-adjacent and Southeast markets – especially in Boston, Los Angeles, New Jersey and Dallas – they have seen the highest increases in in-place rents. Despite the increased costs, demand has risen as companies demand high quality space.
The spread between market average in-place rents and the average rate of a lease signed within the last twelve months was $2.22 per square foot in January. Bridgeport recorded the highest premium for a new lease at $5.22 more per square foot, followed by Miami, New Jersey and Boston.
In 2024, industrial transactions nationwide totaled $69.2 billion in 2024, trading at an average of $129 per square foot. The Bay Area had the nation’s highest prices at $414 per square foot. However, Phoenix – with 17.7 million square feet under construction — scored the highest industrial sales volume in the West, rising from $2 billion in 2023 to $3.4 billion at the end of 2024. In most Western regions, in-place rents remained high but saw little rent growth.
In the Midwest, the picture was more nuanced. Generally, industrial markets were more affordable than elsewhere, posting in-place rents below the national average of $8.35 per square foot. The region’s highest rents were in the Twin Cities at $7.20 per square foot. The region’s sale prices were the lowest in the country, peaking at $95 in the Twin Cities.
The nation’s highest vacancy rate was recorded in Chicago at 10%, while Detroit’s was one of the lowest at 5.5% “highlighting its relative stability amid broader market shifts.” Nevertheless, $3 billion in industrial sales were closed in Chicago in 2024, even at $92 per square foot – the sixth highest total in the USA.
In the South, industrial markets combined affordability and high transaction activity at the end of 2024. Only Miami exceeded the national in-place rent average with $12.25 per square foot, up 12% from the prior year. It ranked as the fourth most expensive industrial market in the country. Dallas-Fort Worth ($6 billion) and Houston ($3.4 billion) recorded the nation’s highest industrial sales volume. Both metros, along with Memphis, continued to see significant new construction.
The Northeast displayed some of the highest in-place rents in the nation, led by New Jersey at $11.57 per square foot. The state also had one of the highest industrial vacancy rates among major markets at 9.1% — up 450 basis points from the previous year. However, it also saw sales prices increase to $210 per square foot and it led the nation in total sales volume of $2.8 billion. Sale prices in Boston also rose to $163 per square foot.
- Philippa Maister John Rikko
- March 3, 2025
- Source Link
- Philippa Maister


